参考:https://www.kaggle.com/martj42/international-football-results-from-1872-to-2017/kernels
# -*- coding: utf-8 -*-
'''
Created on 2018年7月2日
@author: user
@summary: Predicting the winner of the 2018 FIFA World Cup
'''
import numpy as np # linear algebra
import pandas as pd # data processing
from sklearn import linear_model
from sklearn.model_selection import train_test_split
from sklearn.metrics import roc_auc_score
from sklearn.pipeline import Pipeline
from sklearn.preprocessing import PolynomialFeatures
from itertools import combinations
import networkx as nx
from networkx.drawing.nx_pydot import graphviz_layout
from matplotlib import pyplot as plt
import os
#download graphviz
#https://graphviz.gitlab.io/_pages/Download/Download_windows.html
os.environ["PATH"] += os.pathsep + 'E:/workspace/graphviz-2.38/release/bin/'
#pip install pydotplus
#pip install graphviz
#step 1:Data I/O
rankings = pd.read_csv('fifa_ranking.csv')
rankings = rankings.loc[:,['rank', 'country_full', 'country_abrv', 'cur_year_avg_weighted', 'last_year_avg_weighted','two_year_ago_weighted', 'three_year_ago_weighted', 'rank_date']]
rankings = rankings.replace({"IR Iran": "Iran"})
rankings['weighted_points'] = rankings['cur_year_avg_weighted'] + rankings['last_year_avg_weighted']+ rankings['two_year_ago_weighted'] + rankings['three_year_ago_weighted']
rankings['rank_date'] = pd.to_datetime(rankings['rank_date'])
matches = pd.read_csv('results.csv')
matches = matches.replace({'Germany DR': 'Germany', 'China': 'China PR'})
matches['date'] = pd.to_datetime(matches['date'])
world_cup = pd.read_csv('World Cup 2018 Dataset.csv')
world_cup = world_cup.loc[:, ['Team', 'Group', 'First match \nagainst', 'Second match\n against', 'Third match\n against']]
world_cup = world_cup.dropna(how='all')
world_cup = world_cup.replace({"IRAN": "Iran","Costarica": "Costa Rica", "Porugal": "Portugal", "Columbia": "Colombia", "Korea" : "Korea Republic"})
world_cup = world_cup.set_index('Team')
#step 2:Feature Extraction
rankings = rankings.set_index(['rank_date']).groupby(['country_full'], group_keys=False).resample('D').first().fillna(method='ffill').reset_index()
# join the ranks
matches = matches.merge(rankings, left_on=['date', 'home_team'], right_on=['rank_date', 'country_full'])
matches = matches.merge(rankings, left_on=['date', 'away_team'], right_on=['rank_date', 'country_full'], suffixes=('_home', '_away'))
# feature generation
matches['rank_difference'] = matches['rank_home'] - matches['rank_away']
matches['average_rank'] = (matches['rank_home'] + matches['rank_away'])/2
matches['point_difference'] = matches['weighted_points_home'] - matches['weighted_points_away']
matches['score_difference'] = matches['home_score'] - matches['away_score']
matches['is_won'] = matches['score_difference'] > 0 # take draw as lost
matches['is_stake'] = matches['tournament'] != 'Friendly'
#step 3: Modeling
X, y = matches.loc[:,['average_rank', 'rank_difference', 'point_difference', 'is_stake']], matches['is_won']#'score_difference'
X_train, X_test, y_train, y_test = train_test_split( X, y, test_size=0.2, random_state=42)
logreg = linear_model.LogisticRegression(C=1e-5)
features = PolynomialFeatures(degree=2)
model = Pipeline([('polynomial_features', features), ('logistic_regression', logreg)])
model = model.fit(X_train, y_train)
print(('AUC score is {0:0.2}'.format(roc_auc_score(y_test, model.predict_proba(X_test)[:,1]))))
#step4: World Cup simulation
#4.1: Group rounds
# let's define a small margin when we safer to predict draw then win
margin = 0.05
# let's define the rankings at the time of the World Cup
world_cup_rankings = rankings.loc[(rankings['rank_date'] == rankings['rank_date'].max()) & rankings['country_full'].isin(world_cup.index.unique())]
world_cup_rankings = world_cup_rankings.set_index(['country_full'])
world_cup['points'] = 0
world_cup['total_prob'] = 0
for group in set(world_cup['Group']):
print('___Starting group {}:___'.format(group))
for home, away in combinations(world_cup.query('Group == "{}"'.format(group)).index, 2):
print("{} vs. {}: ".format(home, away))
row = pd.DataFrame(np.array([[np.nan, np.nan, np.nan, True]]), columns=X_test.columns)
home_rank = world_cup_rankings.loc[home, 'rank']
home_points = world_cup_rankings.loc[home, 'weighted_points']
opp_rank = world_cup_rankings.loc[away, 'rank']
opp_points = world_cup_rankings.loc[away, 'weighted_points']
row['average_rank'] = (home_rank + opp_rank) / 2
row['rank_difference'] = home_rank - opp_rank
row['point_difference'] = home_points - opp_points
home_win_prob = model.predict_proba(row)[:,1][0]
world_cup.loc[home, 'total_prob'] += home_win_prob
world_cup.loc[away, 'total_prob'] += 1-home_win_prob
points = 0
if home_win_prob <= 0.5 - margin:
print("{} wins with {:.2f}".format(away, 1-home_win_prob))
world_cup.loc[away, 'points'] += 3
if home_win_prob > 0.5 - margin:
points = 1
if home_win_prob >= 0.5 + margin:
points = 3
world_cup.loc[home, 'points'] += 3
print("{} wins with {:.2f}".format(home, home_win_prob))
if points == 1:
print("Draw")
world_cup.loc[home, 'points'] += 1
world_cup.loc[away, 'points'] += 1
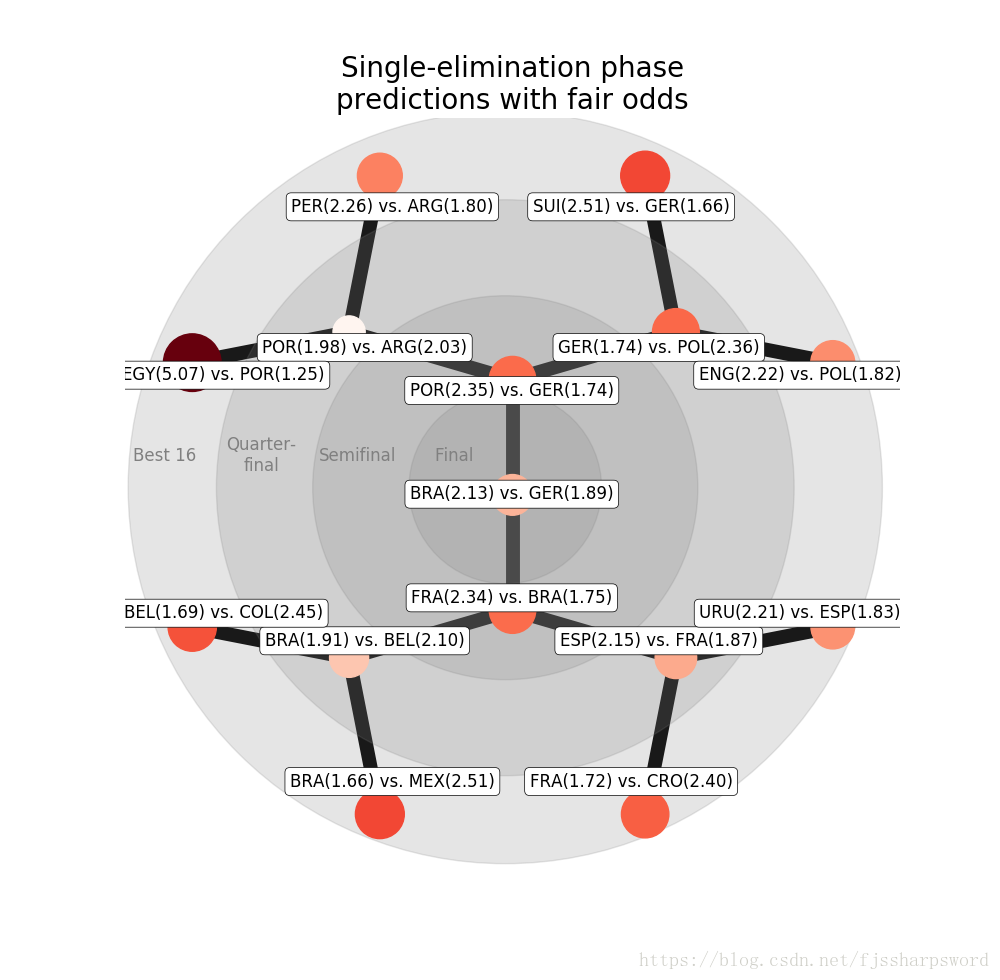
#4.2: Single-elimination rounds
pairing = [0,3,4,7,8,11,12,15,1,2,5,6,9,10,13,14]
world_cup = world_cup.sort_values(by=['Group', 'points', 'total_prob'], ascending=False).reset_index()
next_round_wc = world_cup.groupby('Group').nth([0, 1]) # select the top 2
next_round_wc = next_round_wc.reset_index()
next_round_wc = next_round_wc.loc[pairing]
next_round_wc = next_round_wc.set_index('Team')
finals = ['round_of_16', 'quarterfinal', 'semifinal', 'final']
labels = list()
odds = list()
for f in finals:
print("___Starting of the {}___".format(f))
iterations = int(len(next_round_wc) / 2)
winners = []
for i in range(iterations):
home = next_round_wc.index[i*2]
away = next_round_wc.index[i*2+1]
print("{} vs. {}: ".format(home,away))
row = pd.DataFrame(np.array([[np.nan, np.nan, np.nan, True]]), columns=X_test.columns)
home_rank = world_cup_rankings.loc[home, 'rank']
home_points = world_cup_rankings.loc[home, 'weighted_points']
opp_rank = world_cup_rankings.loc[away, 'rank']
opp_points = world_cup_rankings.loc[away, 'weighted_points']
row['average_rank'] = (home_rank + opp_rank) / 2
row['rank_difference'] = home_rank - opp_rank
row['point_difference'] = home_points - opp_points
home_win_prob = model.predict_proba(row)[:,1][0]
if model.predict_proba(row)[:,1] <= 0.5:
print("{0} wins with probability {1:.2f}".format(away, 1-home_win_prob))
winners.append(away)
else:
print("{0} wins with probability {1:.2f}".format(home, home_win_prob))
winners.append(home)
labels.append("{}({:.2f}) vs. {}({:.2f})".format(world_cup_rankings.loc[home, 'country_abrv'],
1/home_win_prob,
world_cup_rankings.loc[away, 'country_abrv'],
1/(1-home_win_prob)))
odds.append([home_win_prob, 1-home_win_prob])
next_round_wc = next_round_wc.loc[winners]
print("\n")
#4.3: visualization of fair odds
node_sizes = pd.DataFrame(list(reversed(odds)))
scale_factor = 0.3 # for visualization
G = nx.balanced_tree(2, 3)
pos = graphviz_layout(G, prog='twopi', args='')
centre = pd.DataFrame(pos).mean(axis=1).mean()
plt.figure(figsize=(10, 10))
ax = plt.subplot(1,1,1)
# add circles
circle_positions = [(235, 'black'), (180, 'blue'), (120, 'red'), (60, 'yellow')]
[ax.add_artist(plt.Circle((centre, centre),
cp, color='grey',
alpha=0.2)) for cp, c in circle_positions]
# draw first the graph
nx.draw(G, pos,
node_color=node_sizes.diff(axis=1)[1].abs().pow(scale_factor),
node_size=node_sizes.diff(axis=1)[1].abs().pow(scale_factor)*2000,
alpha=1,
cmap='Reds',
edge_color='black',
width=10,
with_labels=False)
# draw the custom node labels
shifted_pos = {k:[(v[0]-centre)*0.9+centre,(v[1]-centre)*0.9+centre] for k,v in pos.items()}
nx.draw_networkx_labels(G,
pos=shifted_pos,
bbox=dict(boxstyle="round,pad=0.3", fc="white", ec="black", lw=.5, alpha=1),
labels=dict(zip(reversed(range(len(labels))), labels)))
texts = ((10, 'Best 16', 'black'), (70, 'Quarter-\nfinal', 'blue'), (130, 'Semifinal', 'red'), (190, 'Final', 'yellow'))
[plt.text(p, centre+20, t,
fontsize=12, color='grey',
va='center', ha='center') for p,t,c in texts]
plt.axis('equal')
plt.title('Single-elimination phase\npredictions with fair odds', fontsize=20)
plt.show()

转载自原文链接, 如需删除请联系管理员。
原文链接:2018年世界杯赔率预测,转载请注明来源!